shutterstock_167012954 Courtesy: Shutterstock
9 January 2020

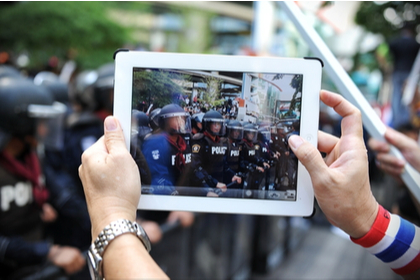
Digital Natives’ protest goes offline

The current wave of protests sweeping India and the government’s suspension of internet services to impede communication has led to innovation. Protesters have taken recourse to offline messaging applications to escape detection while executing their plans. This infographic tracks the evolution of online media – from the basic to the more discreet

shutterstock_1420700369 Courtesy: Shutterstock
24 October 2019

Global protests: leaderless, youthful, persistent

There has been a wave of civil protests across the globe since early 2019 which have taken governments by surprise by their sheer intensity and resilience. The common impelling factor has been discontent with government. Other factors for the current wave, beginning with the Arab Uprising in 2011, have been corruption and regressive constitutional changes. This infographic charts the arc of the outcry

2-8-18 CableMap-02 - Copy Courtesy: Gateway House
2 August 2018

Version 2: Mapping China’s global telecom empire

This version of the Gateway House Map on China’s Expanding Global Telecom Empire identifies some more telecommunication assets -- optic-fibre and satellite ground stations -- that Beijing is working on in South and Central America, Africa, Myanmar, the Indian Ocean Region and mainland China besides the existing ones, such as the Pakistan East Africa Cable Express (PEACE). It shows the direction China’s investment is taking, its diplomatic overtures and the larger geopolitical implications of its growing telecom empire

CableMap-web Courtesy: Gateway House
5 April 2018

Version 1: China’s strategic edge in covert communications

China is steadily deploying state-of-the-art communications systems to connect its strategic and economic assets in Asia. It is then linkingthe Asian mainland to Africa, and Africa to South America. The investment spree is rapidly making Beijing a major player in global telecommunications – and ‘informationisation warfare’.

indias-global-energy-footprint Courtesy: Gateway House
14 February 2017

India’s global energy footprint

Trends in technology, geopolitics and geoeconomics have dramatically transformed the global energy scenario in the last two years. This means favourable conditions for import-dependent India, which must use the opportunities available to reduce its vulnerability to high energy prices. The jump in oil prices past the $60 mark suggests that India must act with alacrity. India’s Energy Footprint Map offers a profile of India’s global trade and investment in energy, and indicates what India can do to access cheap and reliable supplies

GH_5050-3-page-001 (1) Courtesy: Gateway House
22 December 2016

The year of the close vote: a 50:50 world

The year 2016 is the year of the divided electorate, so close were some of the election outcomes. Deep divisions lurk within voters coming from ostensibly “liberal” political cultures. The trend looks set to continue in the elections that will be fought in dozens of countries in 2017, where the votes could also be divided. Gateway House analyses these results through this infographic

GH_Demonetisation_Web-724x1024 Courtesy: Gateway House
24 November 2016

Demonetisation around the world

Prime Minister Narendra Modi's announcement on November 8 to demonetise notes of the denomination of Rs 500 and Rs 1000 has a precedent. This infographic traces some interesting demonetisation initiatives around the world. From discontinuation of high denomination notes due to lack of circulation, to the use of beer and water as 'real assets' in place of hyper-inflated currency.

Ufa 2015 in Numbers
16 July 2015

Ufa 2015 in Numbers

The Russian city of Ufa, capital of the Republic of Bashkortostan, played host to three major summits from July 8-10—BRICS, SCO and Russia's Eurasian Economic Union (EEU). Here are some of the characteristics and developments from the summit in numbers

Global Stability Map Courtesy: Gateway House
1 August 2012

Global Stability Map 2012

Gateway House prepared a Global Stability Map, using 20 differing indicators, to analyze the stability of 60 countries around the world. Using criteria that are important to the emerging economies of the world, the map provides an Indian perspective of the world today.