
The Global Stability Map, 2012
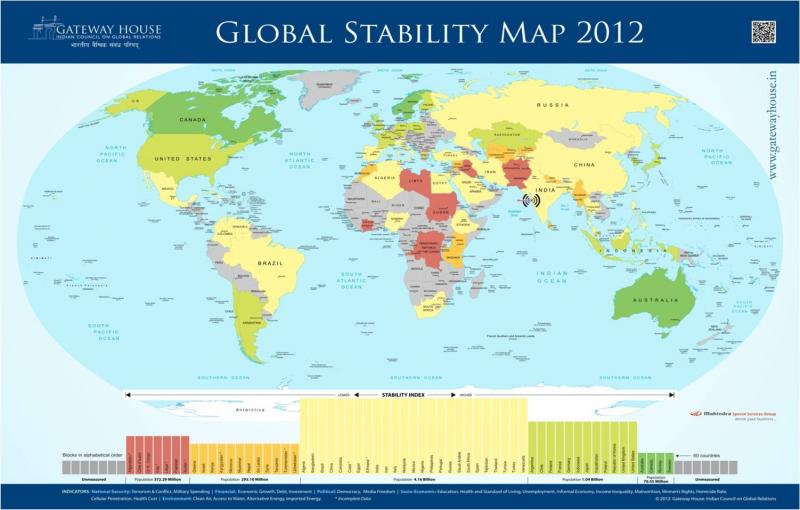
Gateway House’s Global Stability Map 2012 assesses stability in 60 countries around the world. This map is unique in that it views the constancy and strength of nations through an Indian lens. It means the elements of ‘stability,’ heretofore defined by the West, are surveyed through criteria that are important to the emerging economies of the world.
Gateway House analysed 60 countries using 20 differing indicators both traditional, like GDP growth and investment, and less traditional like cell phone penetration, informal economy and health costs. The criteria span the political, financial, socio-economic, national security and environment spectrum. In this definition, access to water and sustained peace are as important as media freedom, while income inequality and cell phone penetration can be more important than the choice of political system.
The resulting map reveals a differing assessment than existing political or investment risk maps. First, it shows that a large part of the world’s population – 4.16 billion – rests in the yellow-coloured middle zone of global stability. This includes nations with a variety of political, economic and social systems. Second, the once lush-green European Union member nations like Greece and Italy that are at the vortex of the global financial crisis, have moved into significantly less stable zones. And emerging countries like Argentina that have managed strong economic development are now in the same zone as the United States and France.
The dominant yellow zone conveys that the world is more positively balanced than ever before, with the potential for even greater stability. This good news contradicts the barrage of gloomy bulletins from the global media, about falling leaders and failing nations which make the world look more unstable save for some developed or autocratic islands.
There are uncertainties to being in the middle. Specifically for India, is the regional domino impact of unstable neighbours. If Pakistan does not assert its civilian political and economic self, the impact of refugees potentially flowing into India’s western region will be negative. That in itself will not push India into instablity. But if simultaneously nothing is done to save the delicate deltas of Bangladesh from a ravaged ecology and flooding, then an estimated 10 million to 30 million climate change refugees could flow into India, causing economic and social stress to India’s already poor and besieged eastern regions. That, in the medium term, will push India into the unstable red zone. Such a circumstance will set back the movement of nations towards the more stable green zones.
Iran, with its historical ties to India, is part of the sweep of middle nations on the map. It has a theocratic government but one that is democratically elected, a vibrant youthful society and an economy that is surviving despite decades of international sanctions. It will only turn unstable and red should it be attacked regionally or by the West.
These path-breaking results are important for domestic and international policymakers, business leaders and citizens to assess when studying global challenges like climate change, food security, financial stability and terrorism. If even one of the middle nations becomes unstable, the domino effect could tip the balance, dragging the world into a possibly predominant orange zone. More optimistically, the support from the yellow middle can provide the ballast necessary to move the unstable zones of orange and red into stability.
The Global Stability Map is available only to Gateway House members. If you are interested in becoming a member, click here for more details.
This map was exclusively created by Gateway House: Indian Council on Global Relations. You can read more exclusive content here.
For interview requests with the author, or for permission to republish, please contact outreach@gatewayhouse.in.
© Copyright 2012 Gateway House: Indian Council on Global Relations. All rights reserved. Any unauthorized copying or reproduction is strictly prohibited.